Getting Started With eWaterCycle#
Welcome to eWaterCycle!#
A more detailed introduction can be found in the why, what and so what explaining what the platform is in more detail. The quick version; eWaterCycle is a platform for hydrological modelling developed by hydrologists and research software engineers. This is done to take away interoperability/compatibility issues hydrologists face, so they can perform their research more easily. We also offer an easy way to generate the forcing data for your model, we standardized the workflow for generating forcing and host ERA5 data ourselves.
The workflow of eWaterCycle, usually, goes as follows:
\( \text{Choose region & design experiment} \rightarrow \text{get forcing} \rightarrow \text{setup model} \rightarrow \text{analyse results} \)
First, in designing your experiment you need to think about the model(s) you want use, the region or regions you want to do research in are also important. This then leads to the 2 essential steps in eWaterCycle: getting the forcing (input) data for your region & running the model(s). The input for different models differ, a quick example of using eWaterCycle can be found here, and it is recommended that you start here. It explains the default workflow quickly and from there you can make alterations to learn to work with the platform.
Once you understand the basics you can change the region (using Caravan, or your own shapefile for example) and change the model you use. Analyzing your results will depend on your workflow, but some examples can be found in the workflows. For advanced workflows one can also couple models. This GitHub repository will host some basic workflows, and it will link to external, more complicated, workflows. These workflows are meant to kickstart your journey with eWaterCycle.
More info on the different models that we support and what they need can be found here. Generating the forcing data is done shown here. This is the same for every model only the user needs to know what type of forcing and variables are needed for their chosen model(s). After the forcing is generated the user can use different workflows, explained here.
YouTube video of eWaterCycle 1.0 (currently 2.4)#
This video showcases the thought train behind eWaterCycle!
How To Get On eWaterCycle#
Click the Launch eWaterCycle JupyterHub button at the top of your screen. It will then ask you to provide a link to your server (it defaults to a server for students). Enter your username and password, it will then pull the getting-started GitHub page to your account and start at the first run notebook.
OR
Follow the rocket in the top right:
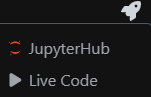 and click on JupyterHub.
(Note: this has to be inside a jupyter notebook page on teachbooks NOTE this cannot be used in external pages yet)
This will take you to
and click on JupyterHub.
(Note: this has to be inside a jupyter notebook page on teachbooks NOTE this cannot be used in external pages yet)
This will take you to 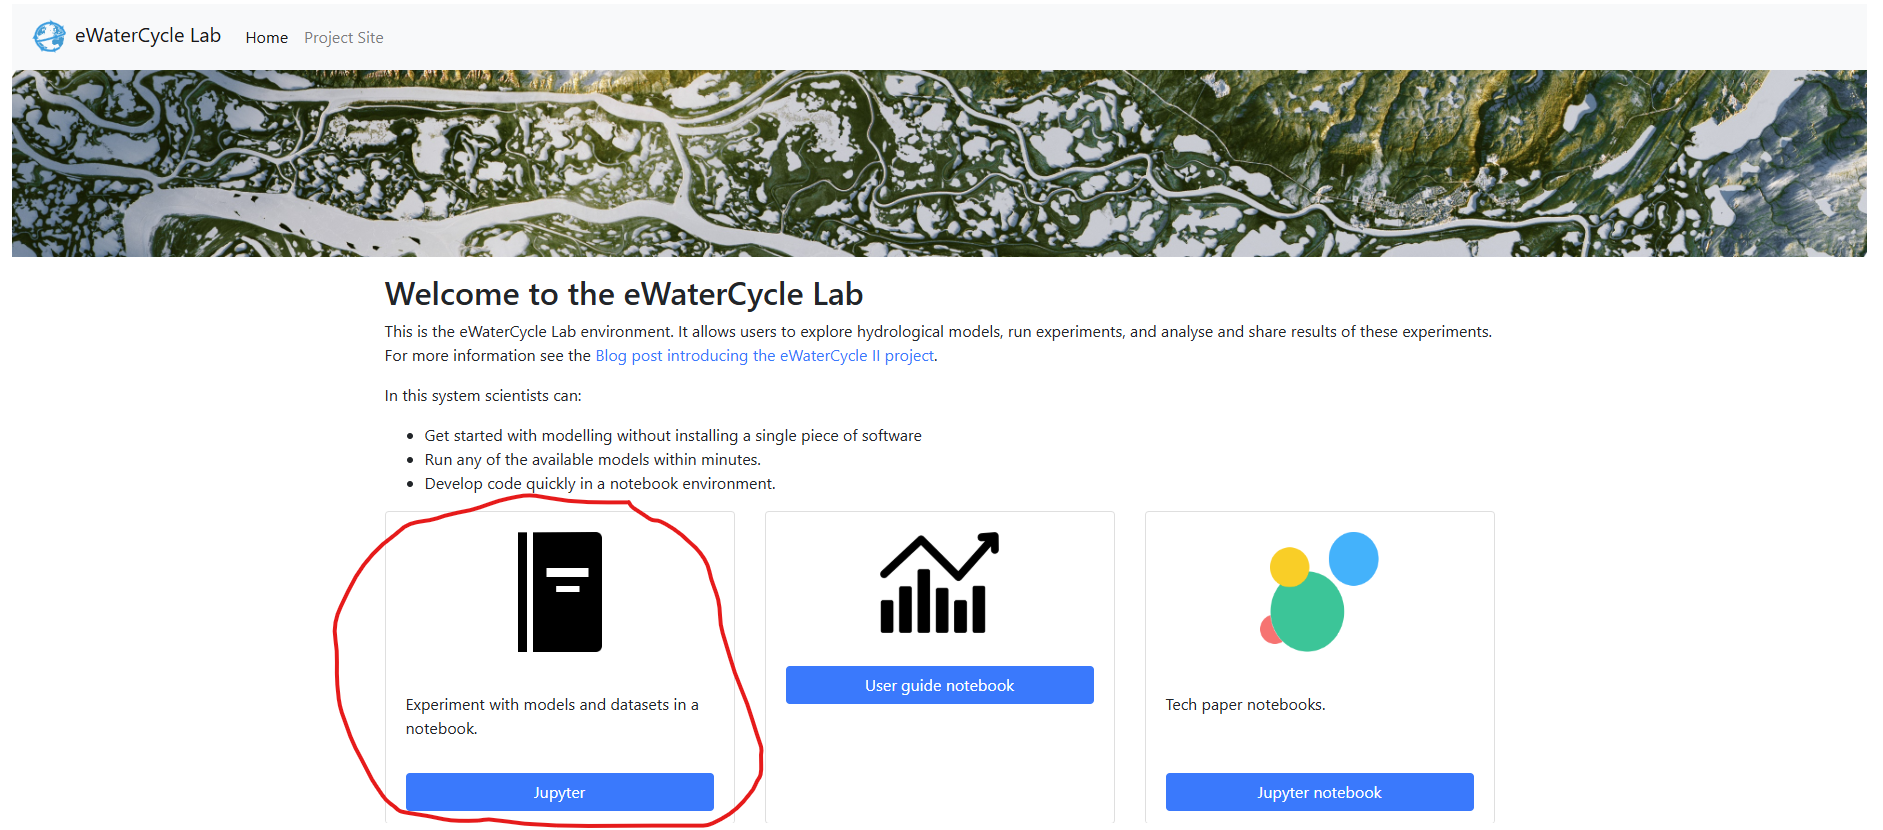 where you need to click Jupyter.
From here you need to use your login.
where you need to click Jupyter.
From here you need to use your login.
Projects#
Numerous studies have been done using eWaterCycle, they can be found on the projects page. This can kickstart your research, by learning from what others have already done!
Workshops#
We also have some workshops that can be found on the workshop page. This is also a good place to start using eWaterCycle as a beginner, as it runs through all the basic steps.
Contents#
A quick overview, this can be seen on the left bar of this teachbook.
Why eWaterCycle?
What is eWaterCycle?
So Why Use eWaterCycle?
First Model Run
Interface
Hello World: Running an HBV Model
Different Forcing Data Generation
Camels Forcing using Caravan
ERA5 reanalysis
Shapefile you made yourself
Shapefile from Caravan dataset
CMIP6 historical data
CMIP6 future data
Manual data input
Different Models
HBV
PCRGlobWB
Wflow
Workflows
Running a Model
Flooding
Drought
Climate change
Calibrating Models
HBV
Comparisons
1 model, multiple forcings
1 forcing, multiple models
Model Coupling
Data Assimilation