Current maximum discharge before flooding of the U4#
Background#
The Wien River finds its origin in the Wienerwald, west of Vienna, and enters the city after approximately 20 km. The river discharges into the Donaukanal. The historical hydrology of the Wien River cannot be reconstructed with certainty. However, before the construction of intercepting sewers along the river in the 1830s and its regulation and channelization at the end of the 19th century, the estimated mean annual discharge was approximately \(2\) \(m^3 / s\) (Pollack et al., 2016).
Since the flood retention basins that were made in the early 1800’s, the 10-year return flood was estimated at \(140\) \(m^3 / s\), and the 100-year return flood at 200 \(m^3 / s\). Due to the high potential losses in the city of Vienna, the Wien River is designed to withstand a 1000-year discharge return period (Faber & Nachtnebel, 2002).
The catchment area of the Wien River can be seen in Figure 2. The observation data used in this research is obtained from the measuring station at the Kennedybrücke. Upstream from the Kennedybrücke the catchment area is rural, and downstream it is urban.
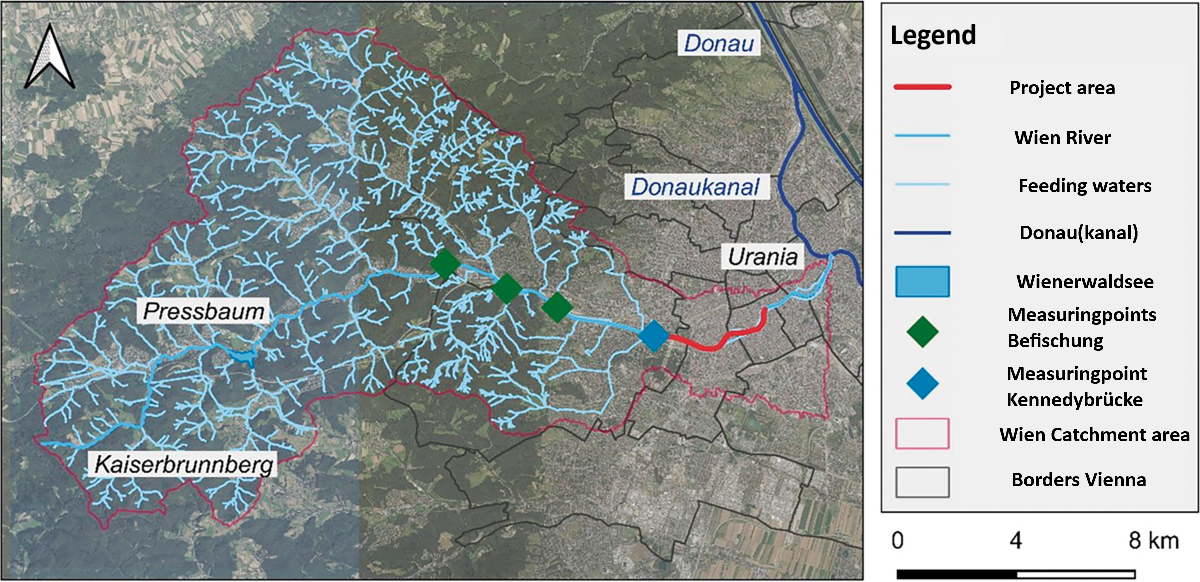
Figure 2: The catchment area of the Wien River, with the measuring station at the Kennedybrücke from which the observation data is obtained. The part upstream from the Kennedybrücke is the rural catchment, and downstream the urban catchment (image taken from: Sindelar et al., 2024).
Determination of flooding threshold#
Literature Study#
Compton et al. (2009, p. 54) state: “A failure that results in the release of water to the U4 occurs when the discharge into the Wien River exceeds the given threshold, resulting in either overtopping of the floodwall or collapse of the floodwall due to either foundation scouring or hydrostatic pressure.” While failure due to overtopping is a function of the flow rate in the channel, uncertainties in the water flow rate are expected to be minimal since the Wien River is a channelized river with well characterized geometry. More uncertainty is expected in the erosive failure and wall collapse which are a function of the shear at the channel bed and the shear strength of the invert.
According to the report, the failure leading to overflowing of the U4 is expected to occur at a discharge of \(530\) \(m^3 / s\). Given the uncertainties in the floodwall’s resistance parameters, this critical discharge is modelled as a normal distribution with mean value of \(530\) \(m^3 / s\) and a standard deviation of \(10\) \(m^3 / s\). This means that at a discharge of around \(510\) \(m^3 / s\) failure could occur with a probability of 5 percent, and at a discharge of around \(550\) \(m^3 / s\) with a probability of 95 percent. (Compton et al., 2009)
The study of Faber (2006) also analyzed flood risk in an Austrian context, and specifically for the Wien River. He estimated peak flow frequencies using the rainfall-runoff model IHW for the rural catchment and ITWH for the urban catchment, and he used Monte Carlo simulations to account for uncertainties. A total of 7000 simulations were performed within the critical range of \(400\) to \(600\) \(m^3 / s\) where failures were most likely to occur. Figure 3 shows that the flood walls can handle discharges up to \(500\) \(m^3 / s\), while overtopping of the floodwall is almost certain at a discharge of \(560\) \(m^3 / s\). The mean value of the discharge capacity before overtopping amounts to \(534\) \(m^3 / s\), with a standard deviation of \(14\) \(m^3 / s\). The mean value of discharge for structural floodwall failure is \(541\) \(m^3 / s\) with a standard deviation of \(16\) \(m^3 / s\) (Faber, 2006).
Faber also analyzed the probabilities of the different failure events, overtopping and structural damage of the flood wall, individually and in combination. The probability of structural flood wall failure without overtopping was not observed in any simulation. The overall system reliability is more than 99 percent, which indicates that failure of the flood wall is extremely rare with the used past peak flows. He further analyzed the return periods of the failure events. The installation of the controlled retention basins in 1998 increased the return period of failure from approximately 550 years to 1100 years. This return period exceeds the 1000-year discharge return period the Wien River is designed for (Faber & Nachtnebel, 2002). This deviation is due to limitations of the return period-based design, which does not fully account for uncertainties in flood frequency and magnitude.
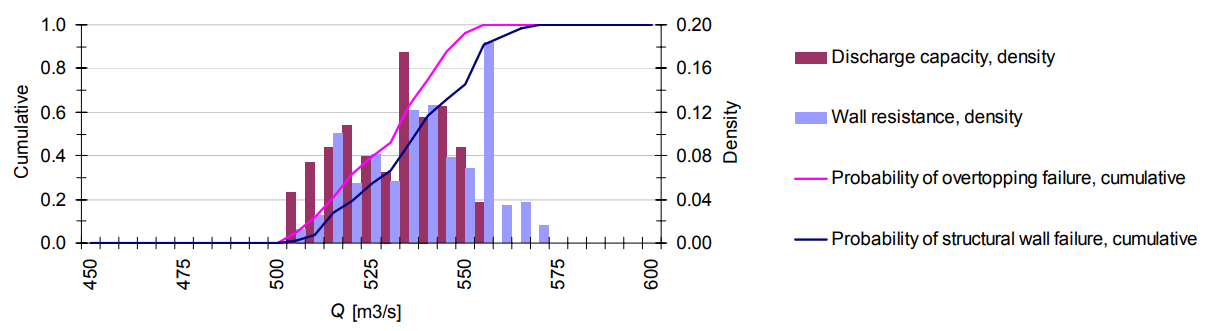
Figure 3: “Distribution of the resistance of the hydraulic system in terms of the bankfull discharge and the flow related to structural floodwall failure”(Faber, 2006)
Conclusion#
It can be concluded that the critical event for flooding of the U4 subway line is overtopping rather than structure failure of the flood wall. According to Faber (2006), the mean failure discharge at which overtopping happens is \(534\) \(m^3 / s\), with a 5 percent probability at \(511\) \(m^3 / s\), and a 95% probability at \(557\) \(m^3 / s\). These values align with the threshold values determined by Compton et al. (2009), who estimated a mean failure discharge of 530 \(m^3 / s\), with 5 and 95 percent probabilities of failure at discharges of approximately \(510\) and \(550\) \(m^3 / s\). The threshold values are normally distributed, so looking at one critical threshold value would be a simplification. The probability of exceeding a threshold is heavily dependent on where that threshold is situated in the normal distribution. For this reason the return periods of all discharges in the normal distribution are calculated. This will give an indication of the return period of a certain discharge, and the probability that this specific discharge will lead to flooding of the U4 subway line. To make comparison easier, the graphs in the research will be illustrated with a threshold value of \(530\) \(m^3 / s\).