Literature Study#
The hydrological system of the Loire river#
The Loire basin is mainly supplied by precipitation, which means that runoff can vary significantly during periods of heavy rainfall or drought. Runoff is usually high in winter and low in summer. At the mouth of the river, the mean discharge in January is around \(1,800\) \(m^3/s\), while in August, it drops to \(250\) \(m^3/s\) (Monteil, et al., 2010). This pattern is also evident in figure 2, which uses historical data from the Blois (the choice for Blois is explained in 2.2), a measurement station more upstream, to illustrate the difference in mean monthly flow between January and August. The average monthly flow in January is approximately \(560\) \(m^3/s\), whereas in August, it drops to around \(115\) \(m^3/s\).
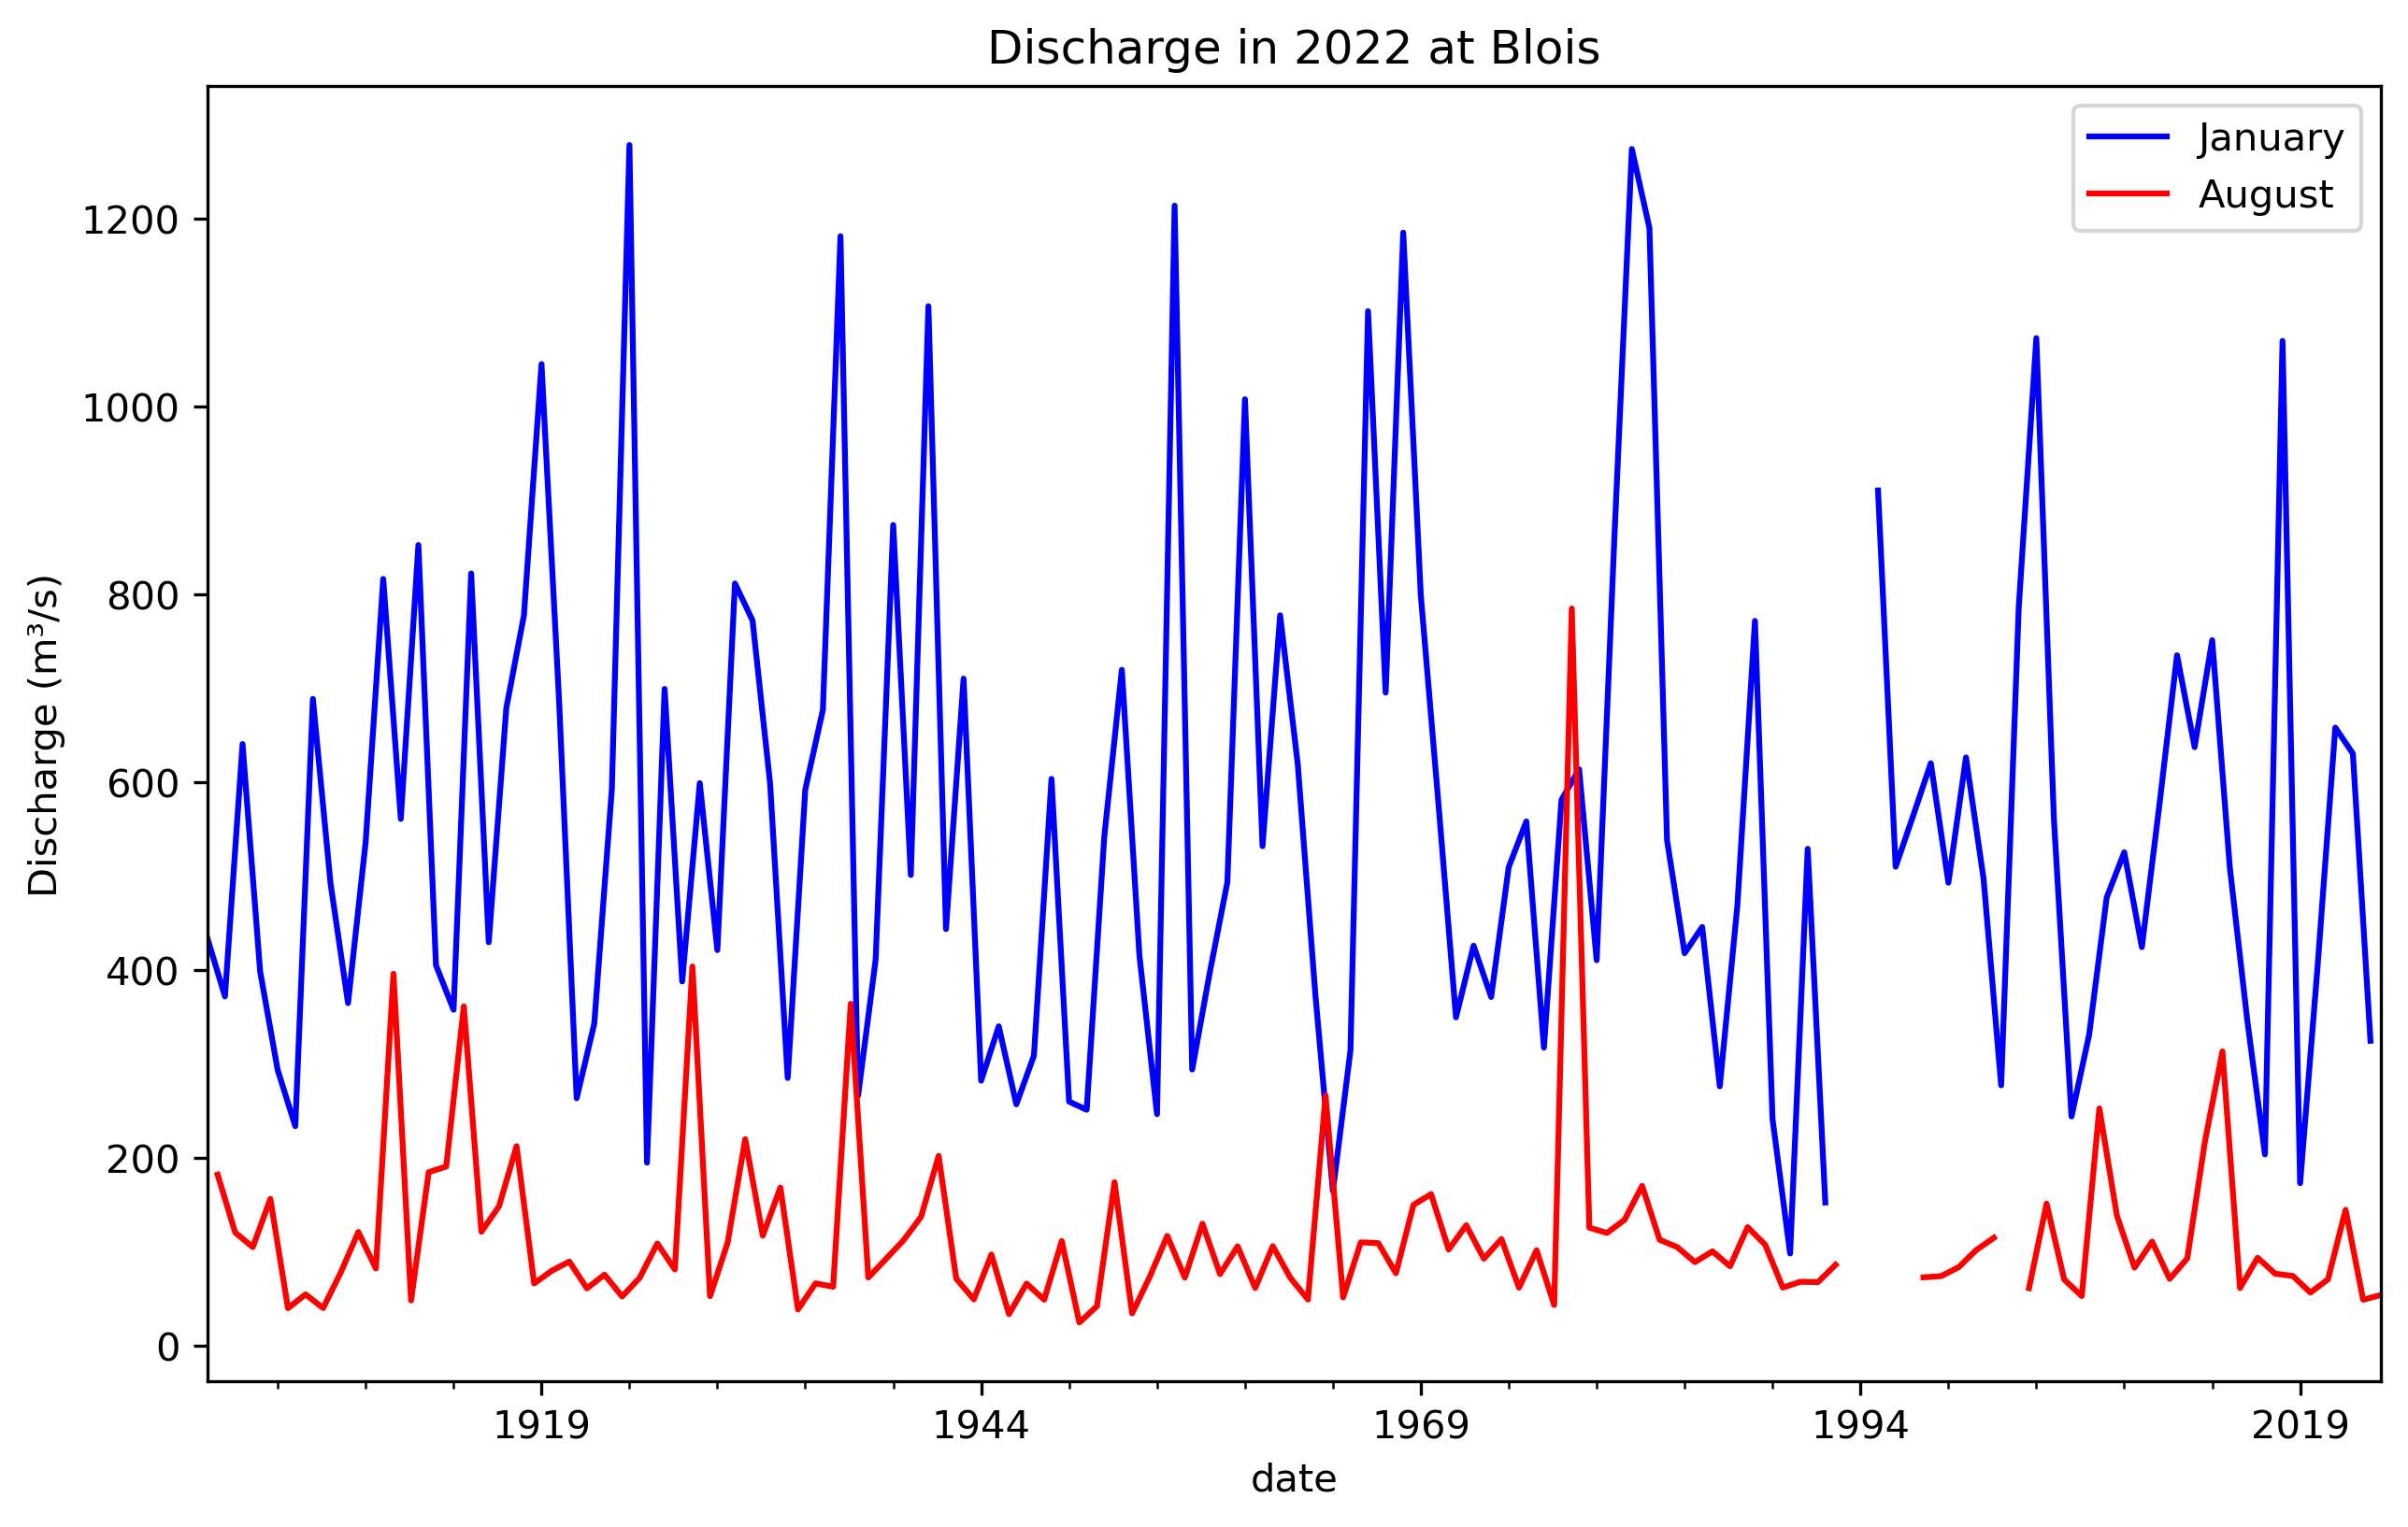 Figure 2: Monthly mean discharge for January and August to show the difference in river flow during low
precipitation month (August), and high precipitation month (January).
Figure 2: Monthly mean discharge for January and August to show the difference in river flow during low
precipitation month (August), and high precipitation month (January).
The contribution of aquifers for the total catchment area is minimal, with a mean discharge of around \(6\) \(m^3/s\) in summer and \(13\) \(m^3/s\) in winter. The impact of snowmelt is also limited, occurring only between January and May. The Loire basin contains multiple reservoirs that help regulate water levels by mitigating floods and replenishing the river during droughts. The main reservoirs, located in Villerest and Naussac, have a combined capacity of \(425\) million \(m^3\) (Moatar, et al., 2022). During prolonged periods of no rainfall, these reservoirs become depleted and can no longer maintain the river’s discharge above a critical threshold.
Therefore, precipitation is the main factor influencing low water discharge.
Critical water flow for the Loire#
To measure periods of drought, it is essential to define a water flow that is associated with drought. To achieve this, a critical water flow needs to be defined for a measurement station of choice. For this case, Blois-sur-Loire is chosen, as this is one with the most historical data.
After the extreme drought in 2022, the official state representative for the Loire department published a report on drought conditions (Préfet d’Indre-et-Loire, 2023). Measurement station Blois-sur-Loire is not mentioned in this report, yet the Gien measurement station is, which is approximately 100 km upstream of Blois. Within this distance there are no major tributaries flowing into the Loire, yet the catchment area is significantly different as visible in figure 3. Consequently, the critical discharge from Gien needs to be recalculated for Blois.
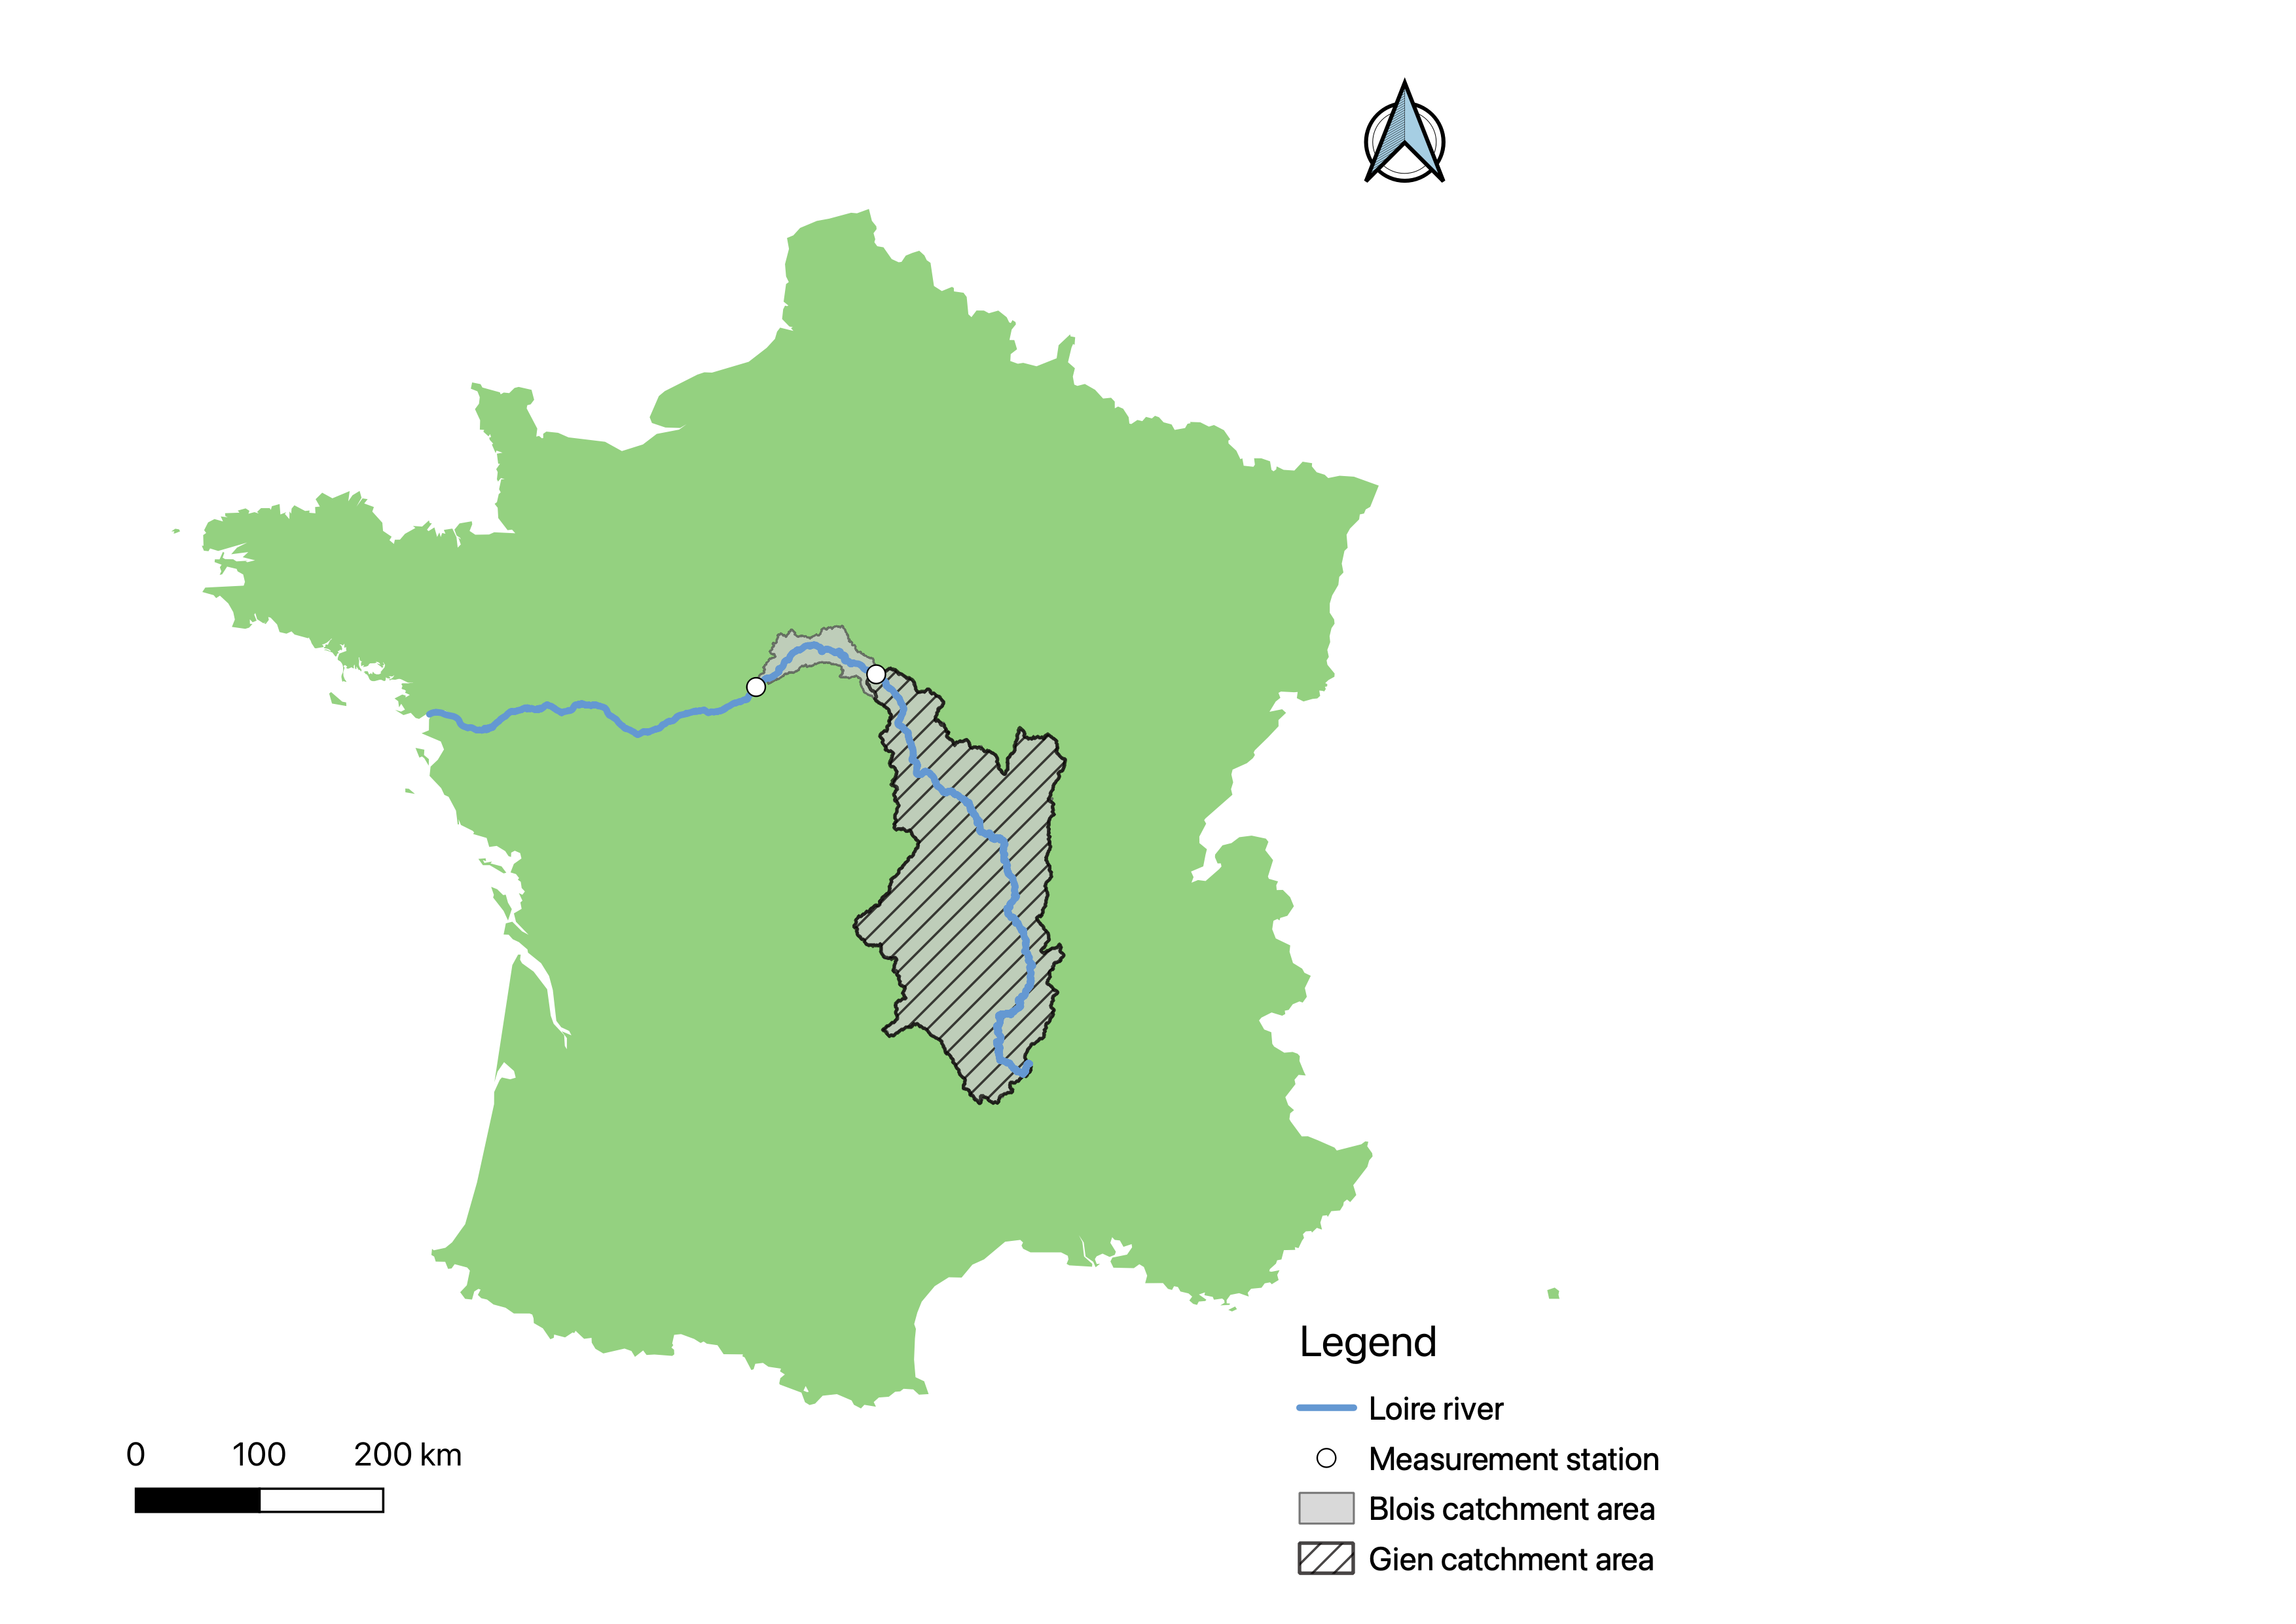 Figure 3: Overview of the measurement stations used in this research and the associated catchment areas.
In the report of the Préfet d’Indre-et-Loire, there is a distinction made between multiple management levels based on low water flow in Gien. The first level is ‘vigilance’ with a flow of \(60\) \(m^3/s\), where communication and awareness measures are started if the low water trend is expected to sustain. The second level is ‘heightened alert’ with a flow of \(50\) \(m^3/s\), where the first limitations of water use are implemented. The main restrictions are on personal water use, where unnecessary water demands are partially or fully restricted. Watering sport fields and gardens is prohibited during the day. Filling private swimming pools or fountains becomes fully restricted. The third level is ‘reinforced alert’ with a flow of \(45\) \(m^3/s\), where most of the partially restricted measures become fully restricted. The final level is ‘crisis’ with a flow of \(43\) \(m^3/s\), where only water use to guarantee the safety and health of the French population is permitted.
To evaluate if this crisis discharge can function as the critical water flow for this research, it must be a suitable indicator of drought conditions. At another station Montjean-sur-Loire downstream of Blois, about which more literature is available, the crisis discharge is equal to \(100\) \(m^3/s\). This discharge only occurred three times in over fifty years: in 1976 and twice in the last six years, 2019 and 2022. In these three extreme cases the discharge has not gone much below the crisis level of \(100\) \(m^3/s\) (Préfet de Maine-et-Loire, 2023). Since the crisis threshold is only rarely exceeded, it represents an extreme rather than a continuous indicator of drought conditions.
This suggests that the crisis level is not a clear indicator for the beginning of a drought period. On the other hand, the second measurement level is where the impact of low water flow starts to affect water availability, so the ‘heightened alert’ level is a better fit for this research. Thus, the critical water flow for Gien is equal to \(50\) \(m^3/s\).
This critical water flow must be adjusted to accurately represent the corresponding flow at the Blois station. To achieve this, the historical discharge data for both Gien and Blois were analysed. Since only monthly data is available on Global Runoff Data Centre (GRDC) for Gien, the comparison is conducted using monthly records.
To determine the critical water flow for Blois, an algorithm is used. This algorithm identifies the number of instances where the recorded flow at Gien falls below its critical threshold. The same number of occurrences is then applied to the Blois data to establish its corresponding critical flow value. The adjusted critical water flow for Blois is equal to \(66.5\) \(m^3/s\).