1. Introduction#
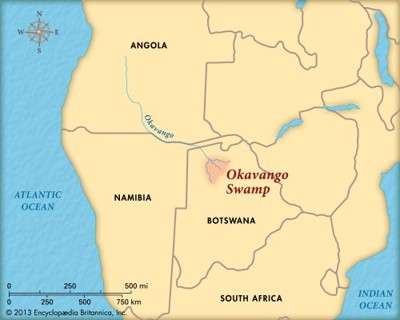
The Okavango River is 1,600 kilometers long, making it the fourth longest river system in southern Africa (Britannica, 2026). The river originates in Angola and flows through Namibia to Botswana where it spills into the Okavango Delta (OKACOM, 2026). The location of the Okavango River is shown in figure 1.1 below (Britannica, 2026). The Okavango Delta is an inland delta in northern Botswana. The delta is a flood-pulsed wetland system that has seasonal floods because of the water that flows from Angola to the delta through the Okavango River (Frain, 2025). The Angolan catchment area responsible for this phenomenon has an area of 135,000 square kilometers and contributes about 95% of the Okavango River’s water (Andersson, et al., 2003). The water flowing through the river contributes 76,5% of the total water supply of the Okavango Delta, with the remaining 23,5% coming from the local rainfall (Hamandawana, et al., 2007). Due to the flat topography between Angola and Botswana, the Angolan rainwater takes a long time to reach the Okavango Delta. This results in peak flood period during the dry season between May and September and low flood period during the wet season between October and April. The highest water level during the year in the Okavango River – at Mohembo, a town just before the delta – is observed at the end of the dry season around April (Gaudaré, et al., 2025).
The Okavango Delta is home to many people and has a rich biodiversity. Approximately one million people depend on the river and the delta for drinking water, fishing, farming, and eco-tourism. The delta is home to “over 1,000 plant species, 130 mammal species, 560 bird species, and nearly 90 types of fish” (Frain, 2025). This ecosystem is dependent on the seasonal flooding as many plant and animal species are adapted to it (EJF, 2026).
Unfortunately, the Okavango River system is vulnerable to climate change. The region experiences rising temperatures and longer dry spells (Frain, 2025). There are already areas in the Okavango Delta that used to flood seasonal and were recently dry for consecutive years. This change has a negative impact on both the communities and the ecosystem. The droughts put stress on both the water availability for the livelihoods of the communities, and the water needs of the animals and plants in the delta’s region (Frain, 2025).
1.1 Problem analysis#
Climate change induced droughts pose challenges on the animals in the Okavango Delta. In April 2024, a herd of hippos got stuck in the mud due to droughts in Botswana and were facing death. The hippos in the Okavango Delta are dependent on the water flowing through the delta, as it fills up the puddles. The deaths of these hippos are not the only negative effect. When hippos are in search of water, they can become aggressive. When they come across people from local communities it can result in human-wildlife conflict (Reynolds, 2024).
This is not the only case where wildlife experienced problems because of droughts in the Okavango Delta. Droughts in the 1980s and 1990s, among other reasons, caused a significant loss of wildlife population in the Okavango Delta (Mail & Guardian, 2011). More recently in 2019, the Okavango Delta had one of the worst droughts to this date. The wildlife struggled to find water and about three hundred hippos got stuck in the muddy water, just like in 2024 (Bhuiyan, 2019).
Andersson, et al. (2006) projected a flow decrease of as high 20% in the period 2050-2080 and as high as 26% in the period 2070-2099 of the Okavango River using the mean of global climate models HadCM3, CCSR/NIES, CCCma CGCM2 and GFDL R30. The models project that the decrease of minimum monthly flow is much higher than the decrease of the annual mean flow. The CCC climate model projects that between 2050 and 2080 the average inflow will not change and that the inflow will decrease about 30% between 2070 and 2100 (Burg , 2007). The CCSR climate model projects less decrease, namely 10% for the period 2050-2080 and just 5% for the period 2070-2100 (Burg , 2007). These projections have a negative impact on the wildlife of the delta, due to a decrease of inflow and thus a dryer Okavango Delta. Not all models project that the discharge will decrease in the future. The GFDL model projects that the average inflow will stay the same in the period 2050-2080 and will increase by 10% in the period 2070-2010 (Burg , 2007). Both the studies of Andersson, et al. (2006) and Burg (2007) used the A2 GHG scenario for the mentioned projections. The A2 scenario is based on an increase of greenhouse gas emissions of 400% between 1990 and 2100. The A2 scenario is similar to the SSP3 scenario (Hausfather, 2018).
There is little research done in connecting the Okavango River discharge to the Okavango Delta’s dry periods and how this changes due to climate change. This study will cover this gap by determining threshold values of which it is likely that a dry period will occur in the delta and how the frequency of too low river discharge will change due to climate change. The hypothesis of this study is that a lower discharge due to climate change will lead to more frequent dry periods in the Okavango Delta. This will impose water-related problems on the wildlife and communities in the region. This hypothesis will be evaluated with the HBV model on the eWaterCycle platform.
1.2 Objective#
The goal of this study is to research how climate change will affect the discharge patterns of the Okavango River and its impact on droughts in the Okavango Delta. This study will answer the following central research question:
“What is the impact of climate change on the future discharge patterns of the Okavango River and how will it impact the frequency of hydrological droughts in the Okavango Delta?”
The following sub-questions will be used to answer the central research question:
“What is the threshold for the discharge of the Okavango River that determines dry periods in the Okavango Delta?”
“How will the rain pattern of the Angolan catchment area change due to climate change?”
“How many times from now until 2100 will be discharge of the Okavango River be too low so that it is likely that a drought will occur in the Okavango Delta?”
1.3 Approach#
To answer the research question and the sub-questions, a literature study needs to be conducted. Connecting historical droughts in the Okavango Delta that caused problems for the wildlife, like in the cases of the hippos, to discharge patterns of the Okavango River will be used to determine a threshold value for the volume that flows into the delta on a yearly basis. In this study, observed data at Mohembo will be used, because it is located just before the Okavango River enters the delta. Determining the threshold value will be done using a percentile. The percentile is chosen so that all the historical dry years are considered, while the years without a known historical drought will be left out. Once the percentile is determined, three different drought categories will be defined: moderate, severe and extreme. Again, these categories will be based on percentiles of the total observed yearly volume at Mohembo.
To predict future occurrences of an insufficient discharge, a hydrological model is used. This study makes use of the eWaterCycle platform. The eWaterCycle platform was developed to make it easier for hydrologists to do their research by taking interoperability/compatibility issues away (Melotto, et al., 2026). In this study, access to data sources like ERA5 and CMIP6 data will be provided by the eWaterCycle platform.
This study uses the Hydrologiska byråns vattenbalansavdelning (HBV) model (Wetterhall, 2026). The HBV model is a conceptual catchment model and it has a relatively simple model structure. Despite the simplicity of the model, the HBV model performed well during several model intercomparisons (Seibert & Bergström, 2022). The HBV model will be used to model past and future discharge patterns of the Okavango River with generated historical ERA5 forcing data of the catchment area. Forcing data consists of precipitation, temperature and radiation. This model will be evaluated against historical data to determine the accuracy of the calibrated parameters. The future discharge patterns of the Okavango River at Mohembo will be projected using CMIP6 generated forcings under different Shared Socioeconomic Pathways (SSP) scenarios. The SSP scenarios “represent different socio-economic developments as well as different pathways of atmospheric greenhouse gas concentrations” (DKRZ, 2026). The scenarios go from SSP1 to SSP5 with increasing anthropogenic radiative forcing and resulting global warming (DKRZ, 2026). First, the historic discharge at Mohembo will be modelled using historic CMIP6 data. To account for bias in the CMIP6 forcing data, quantile mapping will be used on the output of the model. In this study, the same bias will be used for correcting the model output of the future discharge with the different climate scenarios.
To quantify the impact of climate change on the Okavango River, historical return times of the three different drought categories will be compared to the projected return times of the different climate scenarios. Also, the number of droughts per category will be compared to the historical number of occurrences.
1.4 Reading guide#
In Chapter 2, a threshold of the volume of the Okavango River at which it is likely that the Okavango Delta experiences drought will be determined. Chapter 3 will focus on the selection and calibration of the used hydrological model. Different climate scenarios will be used in Chapter 4 to project the future streamflow of the Okavango River. In Chapter 5, future return times of insufficient inflow into the Okavango Delta for different SSP scenarios will be calculated and compared to the historical return times. The discussion and conclusion will be covered in Chapter 6 and Chapter 7.